MGM Stock Chart Signals Possible Near-Term Upside
Shares of MGM Resorts International (NYSE: MGM) are lower by 5% over the past month, but higher by the same amount over the past week. Technical analysis of the casino operator’s stock indicates more near-term upside could be afoot. While shares of the Bellagio operator, along with other gaming names, are struggling in the second […]
The post MGM Stock Chart Signals Possible Near-Term Upside appeared first on Casino.org.
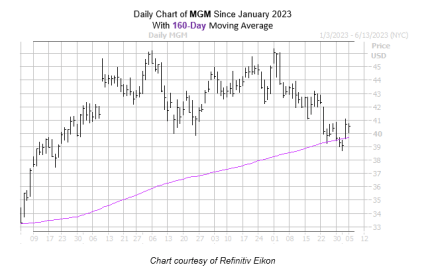
Shares of MGM Resorts International (NYSE: MGM) are lower by 5% over the past month, but higher by the same amount over the past week. Technical analysis of the casino operator’s stock indicates more near-term upside could be afoot.

While shares of the Bellagio operator, along with other gaming names, are struggling in the second quarter, the stock’s flirtation with its 160-day moving average could put it in a strong position. It resides one standard deviation from that important technical level.
According to data from Schaeffer’s Senior Quantitative Analyst Rocky White, four similar signals occurred over the past three years, and the stock finished higher each time, with an average 10.3% one-month gain,” noted Schaeffer’s Investment Research.
In financial parlance, standard deviation gauges a dataset’s dispersion relative to its mean. It is calculated “as the square root of variance by determining each data point’s deviation relative to the mean,” according to Investopedia.
Other Positive Indicators for MGM Stock
Should MGM make a similar move from its 160-day average, the stock could return to the 2023 high it notched following its first-quarter earnings report. In other words, that moving average, as those technical indicators often do, would be acting as a support area for the shares.

Options traders are also signaling a willingness to wager on MGM stock either not faltering much over the near term, or notching a move to the upside.
An unwinding of pessimism in the options pits could create additional tailwinds. MGM’s Schaeffer’s put/call open interest ratio (SOIR) of 1.30 stands in the 96th percentile of readings from the past year, which indicates a put-bias amongst short-term options traders,” added Schaeffer’s.
Options premiums, or the prices traders pay to buy those contracts, on MGM are currently relative to historical standards, indicating market participants aren’t expecting much volatility in the name over the near term. Less turbulence could be conducive to gains for the stock.
MGM Fundamental Factors
Year to date, MGM stock is higher by 22.91%, putting it well ahead of the 11.59% returned by the S&P 500. That’s indicative of solid fundamentals, something the operator can build on in the back half of 2023.
Those potential catalysts include ongoing vibrancy on the Las Vegas Strip, where MGM is the largest operator, and more momentum for the Macau recovery. MGM’s Sin City results were stellar in the first quarter, and that scenario could be elevated by a busy events calendar in the latter half of the year.
In terms of direct impact on the share price, the gaming company could please investors by continuing large-scale share repurchases, which it has done over the past couple of years, and by revealing that its BetMGM is trimming losses and remains on pace to turn profitable before the end of 2023.
The post MGM Stock Chart Signals Possible Near-Term Upside appeared first on Casino.org.

